How to Uncover Trends in Business Intelligence Software: A Data-Driven Approach
In the dynamic landscape of modern business, staying ahead of the curve is no longer a luxury – it’s a necessity. The ability to anticipate market shifts, understand customer behaviors, and optimize operational efficiencies is paramount for sustained success. This is where Business Intelligence (BI) software steps in, providing the tools and insights needed to navigate the complexities of the data-driven world. But how do you truly leverage BI software to uncover trends and gain a competitive edge? This article delves into a comprehensive approach, offering actionable strategies for businesses looking to unlock the full potential of their data.
The focus here is on how to use business intelligence software. We will explore the methodologies, tools, and techniques required to not only analyze data but also to identify emerging patterns and trends that can inform strategic decision-making. From data collection and analysis to visualization and interpretation, we’ll cover the essential steps in the process. This will enable organizations to transform raw data into actionable intelligence. This is crucial to understanding and taking advantage of the power that BI software provides.
Understanding the Fundamentals of Business Intelligence Software
Before diving into trend analysis, it’s crucial to grasp the fundamental principles of BI software. At its core, BI software encompasses a range of tools and technologies designed to collect, process, analyze, and visualize business data. This data can come from various sources, including:
- Sales and Marketing Databases
- Customer Relationship Management (CRM) Systems
- Financial Systems
- Operational Systems
- External Data Sources (e.g., market research reports, social media feeds)
The primary goal of BI software is to transform raw data into meaningful insights that can be used to improve decision-making. It does this through a combination of features, including:
- Data Integration: Combining data from different sources into a unified view.
- Data Warehousing: Storing large volumes of data in a structured format.
- Data Analysis: Applying statistical and analytical techniques to identify patterns and trends.
- Data Visualization: Presenting data in a clear and concise format, such as charts, graphs, and dashboards.
- Reporting: Generating reports that provide insights into key performance indicators (KPIs).
Understanding these core components is essential for effectively using BI software to uncover trends. The right BI software can be a game-changer.
Data Preparation: The Foundation for Trend Analysis
The adage “garbage in, garbage out” holds particularly true in the realm of data analysis. Before any meaningful trend analysis can take place, data must be meticulously prepared. This involves several key steps:
Data Collection
The first step is gathering data from relevant sources. This may involve setting up automated data pipelines, manually extracting data from existing systems, or purchasing data from third-party providers. Data collection must be accurate and comprehensive.
Data Cleaning
Raw data often contains errors, inconsistencies, and missing values. Data cleaning involves identifying and correcting these issues to ensure data accuracy. This may include removing duplicate records, correcting formatting errors, and filling in missing values.
Data Transformation
Data transformation involves converting data into a format that is suitable for analysis. This may include converting data types, creating new variables, and aggregating data. Data transformation prepares the data for analysis.
Data Integration
Integrating data from multiple sources into a unified dataset is a crucial step in trend analysis. This allows for a holistic view of the business and enables the identification of relationships between different data points. Data integration enhances the power of BI software.
Analyzing Data to Discover Trends
Once the data is prepared, the real work of uncovering trends begins. This involves applying various analytical techniques to identify patterns, anomalies, and correlations within the data. Several key methods are commonly used:
Descriptive Analytics
Descriptive analytics provides a summary of past events. This involves calculating descriptive statistics such as means, medians, and standard deviations. Descriptive analytics creates a baseline for further analysis.
Diagnostic Analytics
Diagnostic analytics helps to understand why things happened. This involves drilling down into the data to identify the root causes of specific events or outcomes. Diagnostic analytics finds the causes behind trends.
Predictive Analytics
Predictive analytics uses historical data to forecast future trends. This involves building statistical models to predict future outcomes. Predictive analytics allows you to anticipate future trends.
Prescriptive Analytics
Prescriptive analytics goes a step further by recommending actions to optimize outcomes. This involves using optimization techniques to identify the best course of action. Prescriptive analytics provides actionable insights.
Data Visualization and Interpretation
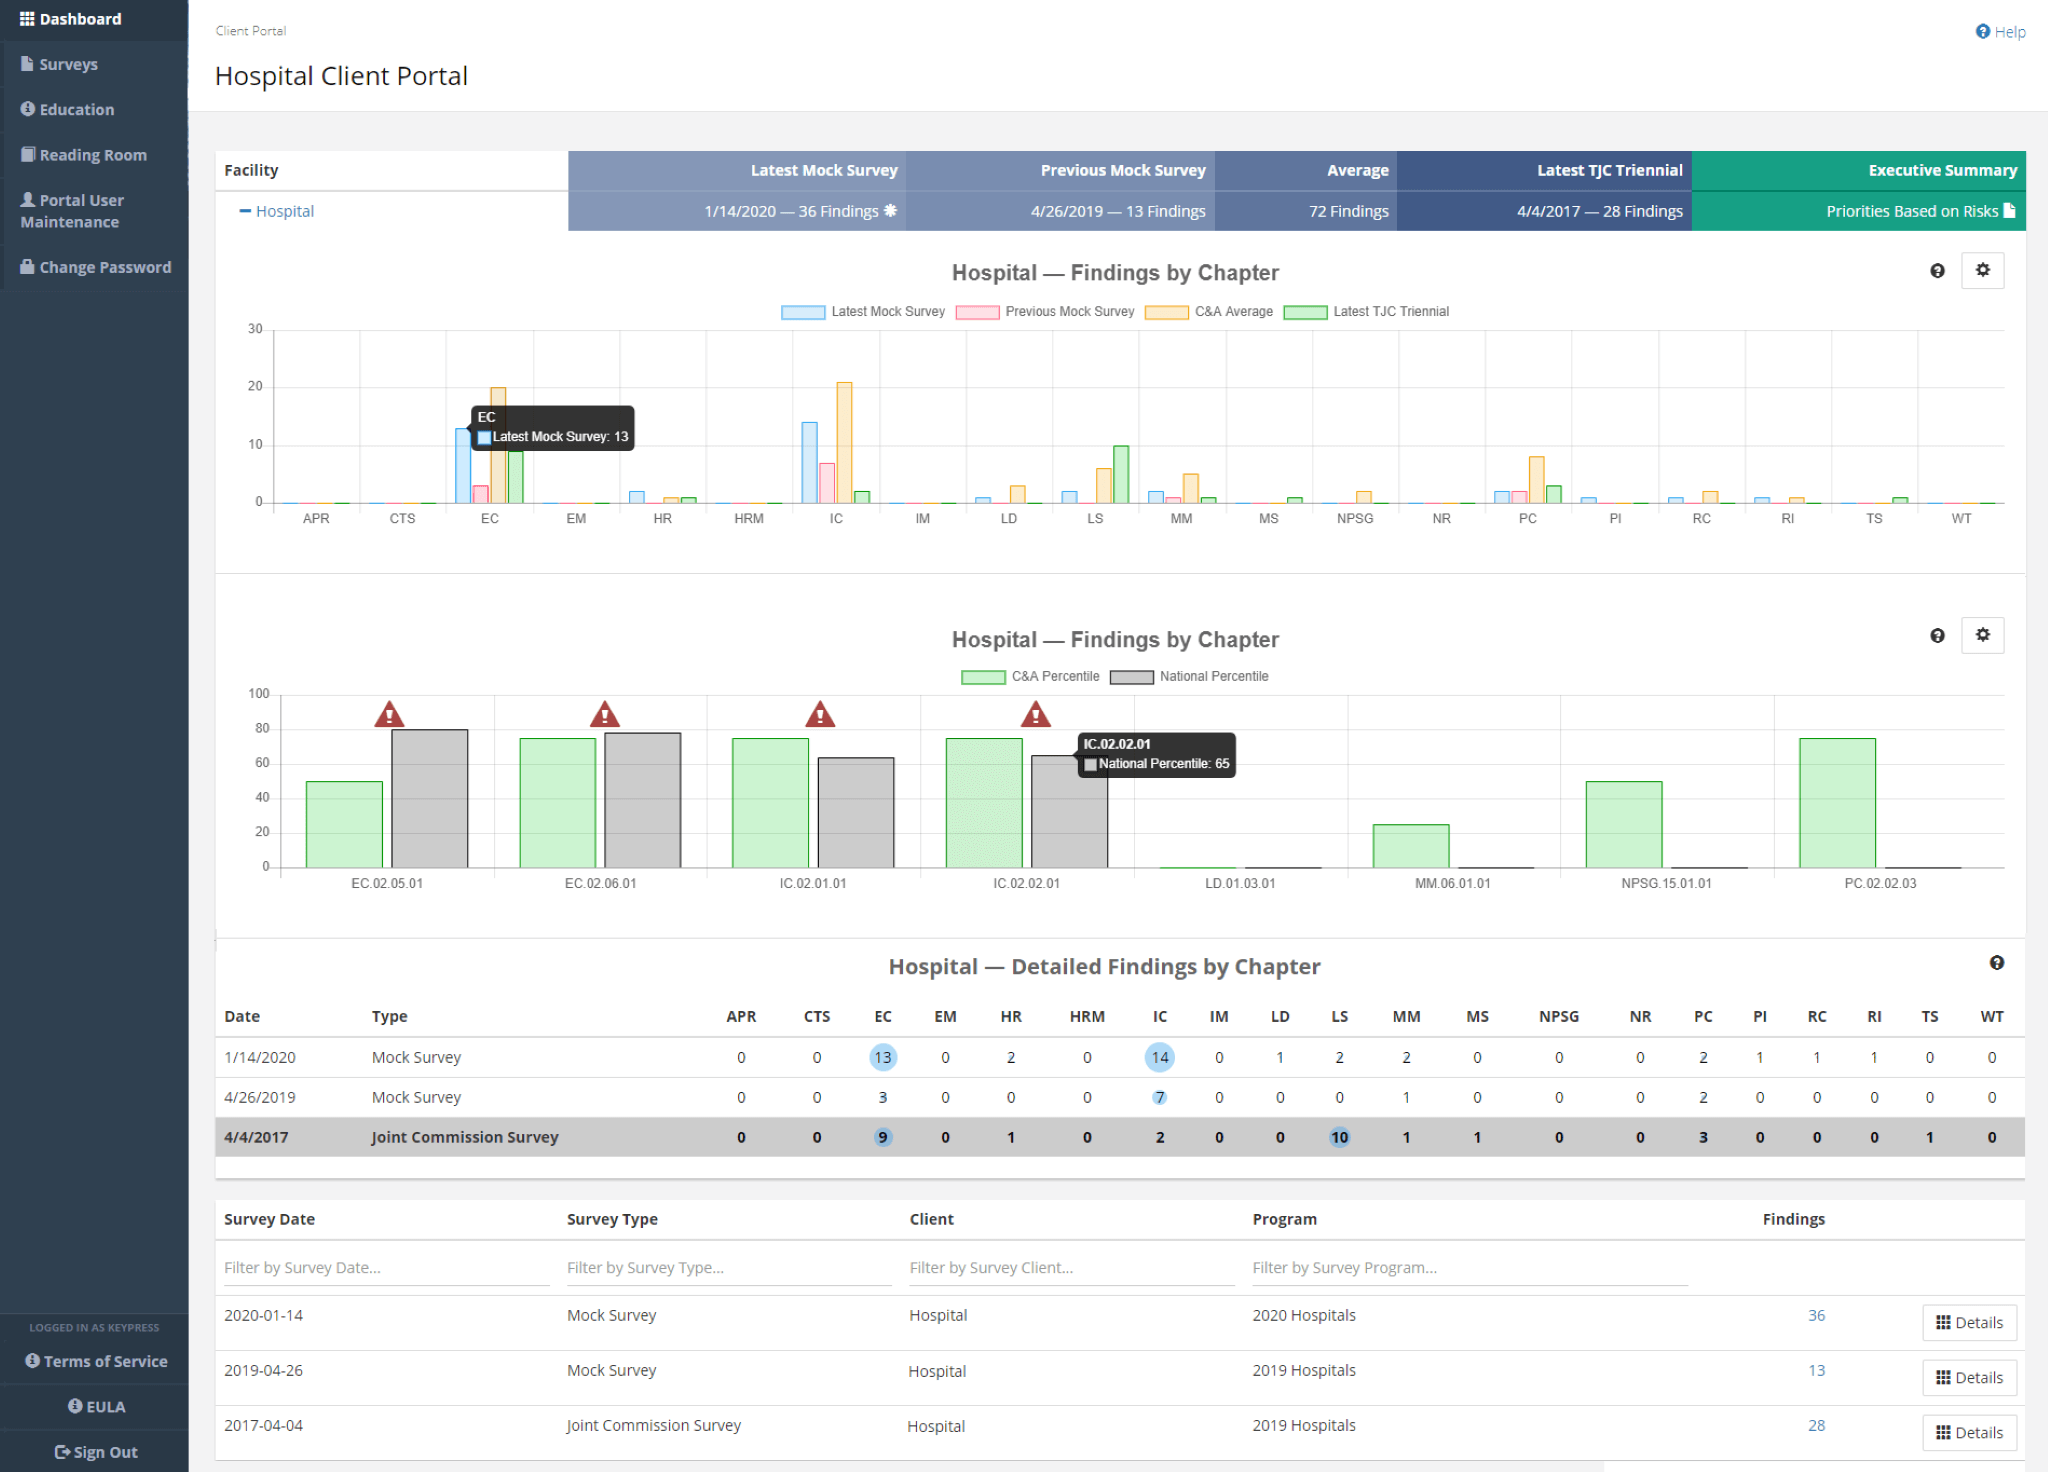
Data visualization is a crucial step in the process of uncovering trends. It involves presenting data in a visual format, such as charts, graphs, and dashboards. Visualization makes data easier to understand. Effective data visualization can help you:
- Identify patterns and trends that might not be apparent in raw data.
- Communicate insights to stakeholders in a clear and concise manner.
- Monitor key performance indicators (KPIs) in real-time.
Choosing the right type of visualization is essential. Different types of charts and graphs are suitable for different types of data and insights. Consider the audience and the message you want to convey. The correct visualization enhances the power of your business intelligence software.
Leveraging Advanced Features of Business Intelligence Software
Beyond the core functionalities, many BI software solutions offer advanced features that can enhance trend analysis:
Machine Learning (ML) and Artificial Intelligence (AI)
ML and AI algorithms can automatically identify patterns and trends that might be missed by human analysts. This includes anomaly detection, predictive modeling, and natural language processing (NLP). ML and AI provide a new dimension to trend analysis.
Real-Time Analytics
Real-time analytics allows for the analysis of data as it is generated. This can be particularly valuable for monitoring fast-changing trends and responding to events in real-time. Real-time analytics keeps you up-to-date.
Advanced Reporting and Dashboards
BI software often includes advanced reporting and dashboarding capabilities. These tools allow you to create customized reports and dashboards that provide a comprehensive view of your business. Advanced reporting and dashboards give you a complete overview.
Best Practices for Uncovering Trends
To maximize the effectiveness of your BI software and uncover trends, consider these best practices:
- Define Clear Objectives: Before starting any analysis, clearly define your objectives. What questions do you want to answer? What trends are you trying to identify?
- Choose the Right Metrics: Select the metrics that are most relevant to your objectives. Focus on the metrics that will provide the most valuable insights.
- Use a Variety of Data Sources: Integrate data from multiple sources to get a holistic view of your business. This will help you identify more comprehensive trends.
- Iterate and Refine: Data analysis is an iterative process. Continuously refine your analysis as you gather more data and gain new insights.
- Collaborate and Communicate: Share your findings with stakeholders and collaborate on how to use those insights to improve decision-making. Communication is key to success.
Case Studies: Real-World Examples of Trend Discovery
To illustrate the power of BI software, let’s explore a few real-world case studies:
Retail Industry
A retail company used BI software to analyze sales data and identify a growing trend: online purchases were outpacing in-store sales. They adjusted their marketing strategy and invested in e-commerce. This helped them to capitalize on the trend and increase revenue.
Healthcare Industry
A hospital used BI software to analyze patient data and identify a trend: an increase in readmissions for a specific condition. They investigated the root causes and implemented a new care plan. This helped them to reduce readmissions and improve patient outcomes. Business intelligence software provided valuable insights.
Manufacturing Industry
A manufacturing company used BI software to analyze production data and identify a trend: a decline in the efficiency of a specific machine. They replaced the machine and optimized their production process. This helped them to improve efficiency and reduce costs. The right software can drive significant improvements.
Choosing the Right Business Intelligence Software
Selecting the right BI software is crucial for effectively uncovering trends. Consider the following factors:
- Ease of Use: Choose software that is easy to use and has a user-friendly interface.
- Scalability: Select software that can scale to meet your growing data needs.
- Integration Capabilities: Ensure that the software can integrate with your existing systems.
- Reporting and Visualization Features: Look for software with robust reporting and visualization capabilities.
- Cost: Consider the cost of the software and whether it fits within your budget.
The Future of Trend Analysis with Business Intelligence Software
The field of BI software is constantly evolving. The future of trend analysis will likely be shaped by:
- Increased Use of AI and ML: AI and ML will play an even greater role in automating trend identification and predictive modeling.
- Greater Focus on Data Democratization: More organizations will empower employees to access and analyze data.
- Integration with Emerging Technologies: BI software will increasingly integrate with technologies such as IoT and blockchain.
As the market evolves, so will the capabilities of business intelligence software. This will make it even easier to uncover trends and gain a competitive advantage.
Conclusion: Embracing the Power of Data
In conclusion, uncovering trends with BI software is a powerful way to gain a competitive edge. By understanding the fundamentals of BI software, preparing data effectively, and applying the right analytical techniques, businesses can transform raw data into actionable insights. The key is not just collecting data, but also analyzing it. This enables them to make informed decisions and drive business growth. By embracing the power of data, organizations can navigate the complexities of the modern business landscape and achieve sustained success. Businesses that use BI software are often more successful. Embrace the power of your data today.
[See also: Related Article Titles]

