Unveiling Insights: How to Present Data Effectively with Business Intelligence Software
In today’s data-driven world, the ability to understand and interpret complex information is crucial for success. Businesses across all industries are generating vast amounts of data. The challenge lies not just in collecting this data, but in transforming it into actionable insights. This is where Business Intelligence (BI) software plays a pivotal role. This article will explore how to effectively present data using BI software, transforming raw numbers into compelling narratives that drive informed decision-making. We will delve into the best practices, tools, and techniques that empower businesses to unlock the full potential of their data.
The Power of Data Visualization
Data visualization is at the heart of effective data presentation. It transforms complex datasets into easily digestible visual representations. Charts, graphs, and other visual elements help to identify trends, patterns, and outliers that might otherwise be missed. BI software offers a wide array of visualization options, allowing users to tailor their presentations to specific audiences and data types. The right visualization can make all the difference in conveying your message clearly and persuasively. Consider the audience and the message you want to deliver when selecting the appropriate visualization.
Choosing the Right Chart Types
Selecting the right chart type is crucial. Different chart types are suited for different types of data and insights. Here are some common chart types and their uses:
- Bar Charts: Ideal for comparing categorical data. They are excellent for showing the relative sizes of different categories.
- Line Charts: Best for displaying trends over time. They help visualize changes in data over a specific period.
- Pie Charts: Useful for showing proportions of a whole. However, use with caution, as they can be difficult to interpret with many slices.
- Scatter Plots: Used to show the relationship between two variables. They are helpful in identifying correlations and clusters.
- Heatmaps: Effective for visualizing data in a matrix format, often used to show the intensity of values across different categories.
Dashboard Design Principles
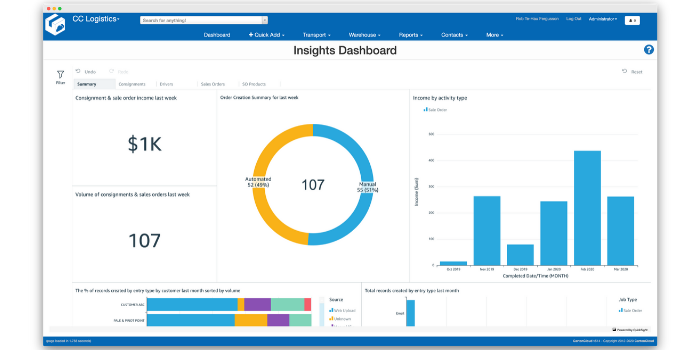
Dashboards are the primary interface for presenting data in BI software. A well-designed dashboard is intuitive, informative, and visually appealing. It should tell a story, guiding the user through the data to arrive at key insights. The following principles are essential for creating effective dashboards:
Clarity and Simplicity
Keep the dashboard clean and uncluttered. Avoid overwhelming the user with too much information at once. Focus on the most important metrics and KPIs. Use clear labels, concise titles, and a logical layout to guide the user’s eye.
Consistency
Maintain a consistent design throughout the dashboard. Use the same fonts, colors, and chart styles. This consistency makes the dashboard easier to understand and navigate. Consistency also enhances the professional appearance of the dashboard.
Interactivity
Enable users to interact with the data. Allow them to filter, drill down, and explore the data in more detail. Interactive elements empower users to investigate specific areas of interest. This interactivity enhances the user experience and promotes deeper understanding.
Relevance
Ensure that the data displayed on the dashboard is relevant to the user’s needs and goals. Tailor the dashboard to the specific audience and the questions they need answered. Focus on the metrics that drive the business and provide actionable insights. Consider the specific needs of the different stakeholders.
Leveraging BI Software Features
BI software offers a range of features that can significantly enhance data presentation. Understanding and utilizing these features is key to maximizing the impact of your data presentations. The features vary based on the software, but many offer similar core functionalities.
Data Integration
BI software can integrate data from multiple sources. This allows users to create a unified view of their data. This consolidated view enables a more holistic understanding of the business. Centralized data integration simplifies reporting and analysis.
Data Modeling
Data modeling involves organizing and structuring data to improve its usability. This can involve creating relationships between different data sets. Data modeling simplifies complex data and makes it easier to analyze. Effective data modeling is the foundation of accurate analysis.
Alerts and Notifications
Set up alerts and notifications to monitor key metrics. This feature automatically alerts users when specific thresholds are met. Alerts enable timely responses to critical events or changes. This proactive approach allows for quick action when needed.
Collaboration and Sharing
BI software typically provides collaboration features. These features allow users to share dashboards and reports with others. Collaboration fosters teamwork and promotes a shared understanding of the data. Secure sharing ensures data confidentiality and accessibility.
Best Practices for Data Presentation
Beyond the technical aspects, several best practices can improve your data presentations. These practices ensure clarity, accuracy, and impact. Applying these techniques will help you present data more effectively.
Know Your Audience
Understand the audience’s background, needs, and goals. Tailor your presentation to their level of understanding. Use language and terminology that resonates with them. Consider their specific areas of interest.
Tell a Story
Data presentation should tell a story. Use data to support your narrative. Guide the audience through the data, leading them to the key insights. A compelling story makes your data more memorable and impactful.
Keep it Concise
Avoid overwhelming the audience with too much information. Focus on the most important findings. Use visuals to support your points. Concise presentations are more effective than lengthy ones.
Provide Context
Always provide context for your data. Explain the background and significance of the metrics. Provide clear definitions and explanations. Context helps the audience understand the meaning of the data.
Ensure Accuracy
Verify the accuracy of your data. Double-check your calculations and visualizations. Errors can undermine the credibility of your presentation. Accurate data is essential for building trust and confidence.
Choosing the Right Business Intelligence Software
The market offers a wide range of BI software solutions. Selecting the right one depends on your specific needs and requirements. Consider the following factors when evaluating BI software:
Ease of Use
Choose software that is easy to learn and use. The software should have an intuitive interface. This will help users quickly create and share data visualizations. User-friendly software reduces training time and increases adoption.
Data Connectivity
Ensure the software can connect to your data sources. It should support various data formats and connectors. Consider the types of data sources you need to integrate. Robust data connectivity is essential for comprehensive analysis.
Visualization Capabilities
Evaluate the range of visualization options offered. The software should support various chart types and customization options. Ensure the software offers the visualization capabilities you need. Powerful visualization tools enhance data storytelling.
Scalability
Choose software that can scale with your business. Consider your future data volume and user needs. The software should be able to handle growth without performance issues. Scalability ensures long-term usability.
Cost
Consider the total cost of ownership. This includes software licensing, implementation, and maintenance. Evaluate the pricing models of different vendors. Compare features and benefits to determine the best value. Consider the long-term costs associated with the software.
The Future of Data Presentation
The field of data presentation is constantly evolving. New technologies and trends are emerging. These advancements are shaping how we present and interpret data.
Artificial Intelligence (AI) and Machine Learning (ML)
AI and ML are transforming data analysis. These technologies can automate insights generation. They can also personalize data presentations. AI-powered tools can identify hidden patterns. These tools enhance data storytelling and improve decision-making.
Interactive and Immersive Data Experiences
Interactive dashboards and immersive experiences are becoming more common. These experiences allow users to explore data in new ways. Virtual reality (VR) and augmented reality (AR) are enhancing data visualization. These technologies create more engaging and informative presentations.
Data Storytelling
Data storytelling is becoming increasingly important. It emphasizes the narrative aspect of data presentation. It focuses on communicating insights in a clear and compelling way. Effective data storytelling drives better decision-making.
By understanding how to effectively present data with Business Intelligence software, businesses can unlock valuable insights. This empowers them to make data-driven decisions and achieve their goals. The key is to choose the right tools, follow best practices, and embrace the latest trends. This approach will help transform raw data into compelling stories that drive success.
Effectively presenting data with Business Intelligence software is more critical than ever. The ability to transform raw data into actionable insights is a core competency for organizations. This article has offered a detailed guide on how to present data effectively. By following these guidelines, businesses can harness the power of their data. They can make informed decisions and drive success. The principles of effective data presentation are applicable across industries. From selecting the right chart types to designing intuitive dashboards, the process is crucial. The choice of BI software will influence the effectiveness of data presentation. Choosing the right software and utilizing its features is essential. Remember to tell a compelling story with your data. This is what will truly resonate with your audience. The future of data presentation is bright. As technology advances, the possibilities for uncovering insights will continue to grow. Mastering the art of data presentation is an ongoing journey. The rewards are significant for those who invest the time and effort.
The ability to present data effectively using BI software is a valuable skill. This skill is increasingly important in today’s business environment. By mastering the techniques and principles outlined in this article, you can significantly improve your ability. You can turn raw data into actionable insights. This will help drive informed decisions and achieve success. The key takeaway is to focus on clarity, accuracy, and relevance. Always remember to tell a compelling story with your data. This is the most effective way to engage your audience and drive impact. [See also: Data Visualization Best Practices, Choosing the Right BI Software, Data Storytelling Techniques]

